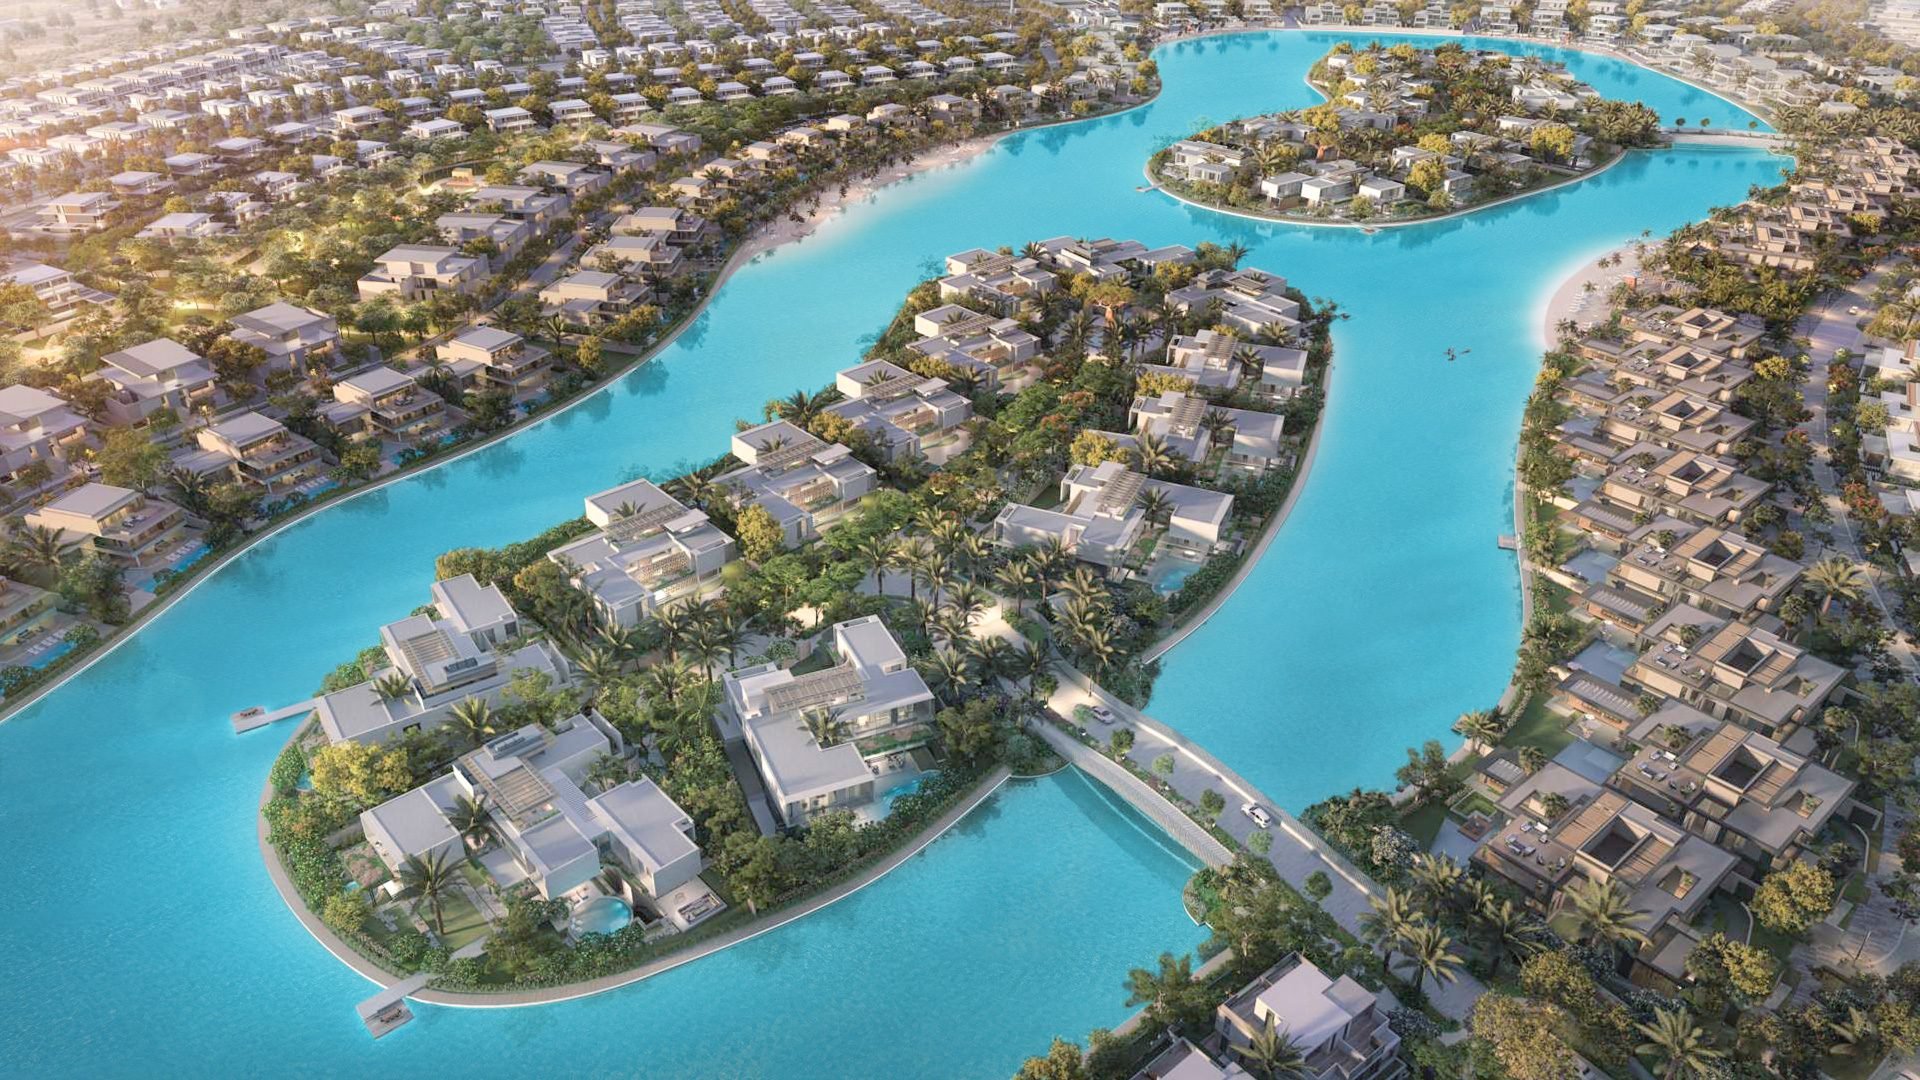
Tilal Al Ghaf recorded 88 sales during Q3 2026, up 44.26% from the second quarter, marking a strong recovery in transaction activity after the quieter period seen earlier in the year.
More importantly, the increase in activity has not come at the expense of pricing. Across the most frequently traded property types, values have largely held, while several communities showed renewed strength during the quarter.
Buyers are also becoming increasingly specific. Location, outlook, plot, privacy, condition and upgrades are creating clearer differences between homes of the same layout, something particularly visible across Harmony and Alaya Gardens.
The higher end of the market also became considerably more active. Elysian Mansion recorded nine sales compared with just one in Q2, while Lanai Islands registered an Edge Mansion sale at AED 91.04M.
Q3 also introduces rental data into the report for the first time, with 279 new leases recorded, up 65.09% from Q2.
The picture coming out of Q3 is positive: transaction activity has returned, values are holding, rents are firming, and the best properties continue to separate themselves from standard stock.
Transaction Volume
Sales increased from 61 in Q2 to 88 in Q3, with activity recorded across 12 sub-communities.
Q3 remains below the 112 transactions recorded during the same period last year, but the direction since the second quarter is encouraging: buyers have returned without the need for broad-based discounting.
Sales volume by quarter
Sales rose to 88 in the third quarter from 61 in the second
Elan led with 18 transactions, followed by Alaya Gardens with 12 and Aura Gardens with 10. Elysian Mansion recorded nine sales, while Harmony accounted for 19 transactions across its three phases.
What stands out is how widely the activity was spread. Alaya North, Alaya Gardens, Elysian Mansion, Plagette 32 and Lanai Islands all became more active during the quarter, while among the active sub-communities only Aura Gardens and Harmony 2 recorded fewer transactions than in Q2.
Sales by sub-community
Elan led with 18 sales, followed by Alaya Gardens with 12
Pricing
Pricing remained relatively stable across the property types with enough transactions to give us a reliable comparison.
Elan 3BR, Elan 4BR and Aura Twin Villas all finished within 1% of their Q2 averages. Aura Gardens 3BR moved higher, while Alaya Gardens Haven also increased quarter-on-quarter.
The averages do not always tell the whole story. As Tilal Al Ghaf matures, location and the individual property are playing a much greater role in pricing. Park backing, privacy, plot position, upgrades and condition can now create significant differences between homes of the same layout.
A registered sale tells us what one buyer paid for one property, but it should not automatically be taken as the market value for every comparable home.
Change in average sale price
Aura Gardens 3BR and Alaya Gardens Haven rose on the quarter, while Amara eased
Against the second quarter of 2026
Against the third quarter of 2025
Sales by sub-community
Elan
Elan was the most active individual sub-community in Q3, recording 18 sales compared with nine in Q2.
What is encouraging is that the additional volume did not require a significant movement in price. Both the 3BR and 4BR averages remained within 1% of the previous quarter.
The 4BR market provides the clearest benchmark, with 12 transactions averaging AED 4.29M. This is a good example of genuine liquidity: more properties changing hands while pricing remains broadly stable.
Year-on-year values are slightly softer, but the Q3 figures suggest Elan has found a relatively consistent trading range for both layouts.
Aura & Aura Gardens
Aura and Aura Gardens recorded 15 sales between them during Q3.
Aura Twin Villas averaged AED 6.53M, almost unchanged from Q2 and 3.86% higher year-on-year. The AED 7.55M transaction sits above the wider market and should be treated with some caution when assessing current values, particularly with other options available below that level during the period.
Aura Gardens 3BR was one of the stronger pricing stories of the quarter, averaging AED 3.97M, up 8.87% from Q2.
The 4BR and Twin Villa figures are based on only two sales each, so less weight should be placed on the headline quarterly movement for those layouts.
Aura and Aura Gardens continue to see consistent buyer demand where pricing and location align.
Harmony
Harmony recorded 19 sales across its three phases, compared with 17 in Q2.
Pricing is becoming increasingly property-specific. Harmony 1 4BR sales ranged from AED 8.20M to AED 11.70M despite being the same underlying layout, reflecting the growing premium for better plots, stronger positions, landscaping, extensions and upgraded homes.
Harmony 3 provided a cleaner 4BR benchmark, with four transactions averaging AED 9.28M and pricing 6.49% higher than Q3 last year.
The AED 6M Harmony 2 4BR sale remains well outside the prevailing market and should not be used as a pricing reference.
Alaya North, Alaya Gardens & Alaya Beach
The Alaya communities were one of the clearest areas of increased activity during Q3. Alaya Gardens recorded 12 sales compared with four in Q2, while Alaya North recorded six compared with one.
The eight Haven transactions in Alaya Gardens provide much better visibility on current pricing, although the wide range needs context. Park-backing homes continue to achieve a clear premium over internal-road properties, and position within the community is becoming increasingly important to buyers.
Alaya North also showed good consistency. Haven sales averaged AED 12M, while three Retreat transactions averaged AED 17.70M.
The AED 26M Reserve sale provides another useful benchmark at the larger end of Alaya Gardens.
Alaya Beach recorded no sales during the quarter.
Amara & Plagette 32
Amara recorded six Twin Villa transactions, averaging AED 7.93M.
Pricing was 4.07% below Q2, although the relatively tight AED 7.60M–8.30M range provides a useful indication of current values.
The quarter also saw the first two Plagette 32 Clubhouse resale transactions of the year, at AED 8.70M and AED 8.95M.
It is still too early to establish a wider pricing trend for Plagette 32, but these transactions begin to give us a clearer secondary-market range.
Elysian Mansion, Serenity Mansion & Lanai Islands
Elysian Mansion recorded nine sales in Q3 compared with just one in Q2, making this one of the most important changes during the quarter.
This follows a pattern I have expected to see at the higher end of Tilal Al Ghaf. With properties at this price level, buyers often need greater certainty around access, views, landscaping and the finished product before the full value begins to appear in transaction data.
This differs from communities such as Aura, Elan and Harmony, where much of the capital appreciation happened before handover. With individual mansions, differences in plot, elevation, view and specification carry considerably more weight, and buyers increasingly want to experience the property before committing.
The six Maia sales are particularly useful, averaging AED 23.18M and reaching AED 27.50M. Hilltop also moved forward, with transactions at AED 37M and AED 39M following the AED 31.71M sale recorded in June.
Lanai Islands recorded an Edge Mansion sale at AED 91.04M.
The deal was agreed during a period of heightened regional uncertainty, which makes it an interesting transaction. While some owners looked to reduce exposure during that period, other buyers saw an opportunity to enter with a longer-term view on Dubai and the region.
It is another reminder that at the right price, demand remains for exceptional assets at the very top of Tilal Al Ghaf.
Serenity Mansion recorded no sales during Q3.
Rentals
Q3 is the first report where rental data has been included alongside sales, giving owners a more complete picture of the market.
279 new leases were registered during the quarter, up 65.09% from the 169 recorded in Q2. A further 141 renewals were registered but are excluded from the figures below so that the averages reflect open-market new leases.
The quarter-on-quarter rental picture was positive. Across every layout with at least ten new leases in both periods, average rents increased, with growth ranging from approximately 0.94% to 9.20%.
The year-on-year picture is more mixed. Elan 3BR rents remain below the same period last year, while Elan 4BR and Aura Gardens 3BR and 4BR are approximately 5% lower. Aura Twin Villas and Harmony 1 4BRs are trading above last year's levels.
For owners, the key point is that rental demand remains strong and rents have firmed since Q2, even though the annual comparison varies between individual property types.
Average annual rent by layout
Average annual rent ranged from AED 180k for an Elan 3BR to AED 517k for a Harmony 2 4BR
Gross Yields
On the layouts where we have enough sales and rental activity to make a sensible comparison, gross yields ranged from approximately 4.59% to 5.35% during Q3.
Aura Gardens 3BR produced the highest of the more reliable comparisons at approximately 5.35%, followed closely by Elan 4BR at 5.30% and Elan 3BR at 5.07%.
Aura Twin Villas were approximately 4.99%, while Harmony 1 4BRs were around 4.59%.
These figures are based on average sale prices and new annual rents before service charges and other ownership costs, so they should be viewed as a market guide rather than a property-specific investment return.
Gross yield by layout
Gross yields ranged from 4.59% to 5.35%
Notable Sales
Key Takeaways
Activity recovered strongly without a broad correction in price
Q3 recorded 88 sales, up 44.26% from Q2. Importantly, the additional activity did not require widespread discounting, with several of the most actively traded layouts remaining close to their Q2 pricing.
The best properties are separating themselves
Buyers are increasingly clear about how they want to live within Tilal Al Ghaf. Park backing, privacy, outlook, plot position, upgrades and condition are creating greater differences between homes that may look identical on paper.
The Alaya communities became considerably more active
Alaya Gardens recorded 12 sales and Alaya North six. Park-backing Haven properties continue to carry a premium over internal-road options, while Retreat pricing has remained relatively consistent.
The upper end of Tilal Al Ghaf is beginning to unlock
Elysian Mansion recorded nine sales compared with one in Q2, while Lanai Islands registered an Edge Mansion at AED 91.04M. As these communities get closer to handover and become easier to access, buyers can better understand the quality and individuality of the finished homes.
The rental market strengthened during the quarter
New leases increased 65.09% quarter-on-quarter to 279, while rents moved higher across every well-traded layout in the quarterly comparison. The annual picture varies by property type, but the direction since Q2 has been positive.
Buyers remain selective, but demand is there
Q3 continues to show a market where buyers will pay for the right home, but they are increasingly unwilling to compromise on position, quality or price. Well-positioned properties continue to achieve strong results, while stock that does not offer the same advantages needs to be priced accordingly.
For a confidential discussion about your property, current values or opportunities within Tilal Al Ghaf, please get in touch.
Share this article
Sources: Dubai Land Department transaction records and Property Monitor rental contract records, July to September 2026. Figures are presented as market context; small samples and atypical transfers can materially affect averages.